Example
An example of computing the periodogram for a more realistic dataset is shown in the following figure. The simulated data here consist of 50 nightly observations of a simulated RR Lyrae-like variable star, with lightcurve shape that is more complicated than a simple sine wave:
(Source code, png, hires.png, pdf)
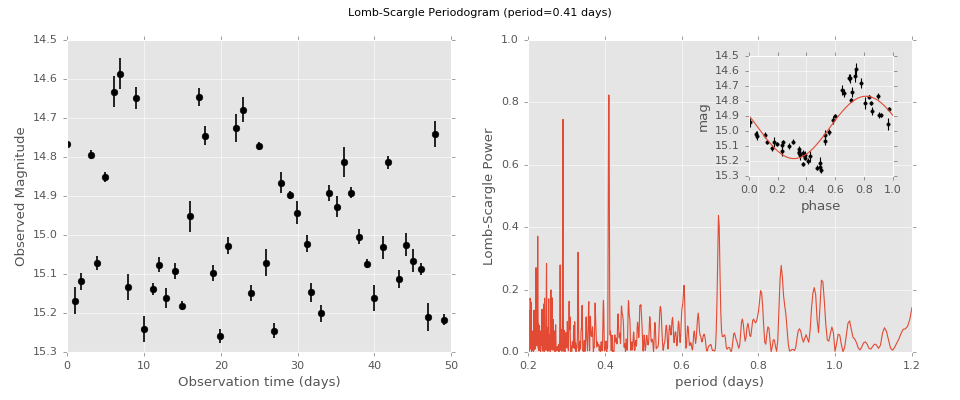
This example demonstrates that for irregularly-sampled data, the Lomb-Scargle periodogram can be sensitive to frequencies higher than the average Nyquist frequency: the above data are sampled at an average rate of roughly one per day, and the periodogram relatively cleanly reveals the true period of 0.41 days, though there are aliases due to the interaction between the 0.41-day signal and the roughly 1.0-day observing window.