 This is an excerpt from the
 Preface
What Is Data Science?
This is a book about doing data science with Python, which immediately begs the question: what is data science? It's a surprisingly hard definition to nail down, especially given how ubiquitous the term has become. Vocal critics have variously dismissed the term as a superfluous label (after all, what science doesn't involve data?) or a simple buzzword that only exists to salt resumes and catch the eye of overzealous tech recruiters.
In my mind, these critiques miss something important. Data science, despite its hype-laden veneer, is perhaps the best label we have for the cross-disciplinary set of skills that are becoming increasingly important in many applications across industry and academia. This cross-disciplinary piece is key: in my mind, the best extisting definition of data science is illustrated by Drew Conway's Data Science Venn Diagram, first published on his blog in September 2010:
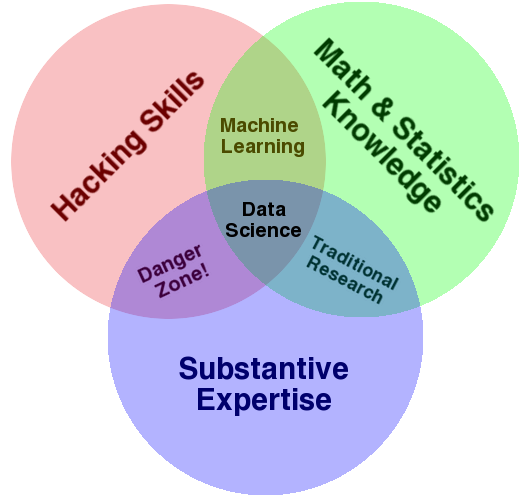
(Source: [Drew Conway](http://drewconway.com/zia/2013/3/26/the-data-science-venn-diagram). Used by permission.)
While some of the intersection labels are a bit tongue-in-cheek, this diagram captures the essence of what I think people mean when they say "data science": it is fundamentally an interdisciplinary subject. Data science comprises three distinct and overlapping areas: the skills of a statistician who knows how to model and summarize datasets (which are growing ever larger); the skills of a computer scientist who can design and use algorithms to efficiently store, process, and visualize this data; and the domain expertise—what we might think of as "classical" training in a subject—necessary both to formulate the right questions and to put their answers in context.
With this in mind, I would encourage you to think of data science not as a new domain of knowledge to learn, but a new set of skills that you can apply within your current area of expertise. Whether you are reporting election results, forecasting stock returns, optimizing online ad clicks, identifying microorganisms in microscope photos, seeking new classes of astronomical objects, or working with data in any other field, the goal of this book is to give you the ability to ask and answer new questions about your chosen subject area.
Who Is This Book For?
In my teaching both at the University of Washington and at various tech-focused conferences and meetups, one of the most common questions I have heard is this: "how should I learn Python?" The people asking are generally technically minded students, developers, or researchers, often with an already strong background in writing code and using computational and numerical tools. Most of these folks don't want to learn Python per se, but want to learn the language with the aim of using it as a tool for data-intensive and computational science. While a large patchwork of videos, blog posts, and tutorials for this audience is available online, I've long been frustrated by the lack of a single good answer to this question; that is what inspired this book.
The book is not meant to be an introduction to Python or to programming in general; I assume the reader has familiarity with the Python language, including defining functions, assigning variables, calling methods of objects, controlling the flow of a program, and other basic tasks. Instead it is meant to help Python users learn to use Python's data science stack–libraries such as IPython, NumPy, Pandas, Matplotlib, Scikit-Learn, and related tools–to effectively store, manipulate, and gain insight from data.
Why Python?
Python has emerged over the last couple decades as a first-class tool for scientific computing tasks, including the analysis and visualization of large datasets. This may have come as a surprise to early proponents of the Python language: the language itself was not specifically designed with data analysis or scientific computing in mind. The usefulness of Python for data science stems primarily from the large and active ecosystem of third-party packages: NumPy for manipulation of homogeneous array-based data, Pandas for manipulation of heterogeneous and labeled data, SciPy for common scientific computing tasks, Matplotlib for publication-quality visualizations, IPython for interactive execution and sharing of code, Scikit-Learn for machine learning, and many more tools that will be mentioned in the following pages.
If you are looking for a guide to the Python language itself, I would suggest the sister project to this book, "A Whirlwind Tour of the Python Language". This short report provides a tour of the essential features of the Python language, aimed at data scientists who already are familiar with one or more other programming languages.
Python 2 vs Python 3
This book uses the syntax of Python 3, which contains language enhancements that are not compatible with the 2.x series of Python. Though Python 3.0 was first released in 2008, adoption has been relatively slow, particularly in the scientific and web development communities. This is primarily because it took some time for many of the essential third-party packages and toolkits to be made compatible with the new language internals. Since early 2014, however, stable releases of the most important tools in the data science ecosystem have been fully compatible with both Python 2 and 3, and so this book will use the newer Python 3 syntax. However, the vast majority of code snippets in this book will also work without modification in Python 2: in cases where a Py2-incompatible syntax is used, I will make every effort to note it explicitly.
Outline of the Book
Each chapter of this book focuses on a particular package or tool that contributes a fundamental piece of the Python Data Sciece story.
- IPython and Jupyter: these packages provide the computational environment in which many Python-using data scientists work.
- NumPy: this library provides the
ndarrayfor efficient storage and manipulation of dense data arrays in Python. - Pandas: this library provides the
DataFramefor efficient storage and manipulation of labeled/columnar data in Python. - Matplotlib: this library provides capabilities for a flexible range of data visualizations in Python.
- Scikit-Learn: this library provides efficient & clean Python implementations of the most important and established machine learning algorithms.
The PyData world is certainly much larger than these five packages, and is growing every day. With this in mind, I make every attempt through these pages to provide references to other interesting efforts, projects, and packages that are pushing the boundaries of what can be done in Python. Nevertheless, these five are currently fundamental to much of the work being done in the Python data science space, and I expect they will remain important even as the ecosystem continues growing around them.
Using Code Examples
Supplemental material (code examples, figures, etc.) is available for download at http://github.com/jakevdp/PythonDataScienceHandbook/. This book is here to help you get your job done. In general, if example code is offered with this book, you may use it in your programs and documentation. You do not need to contact us for permission unless you’re reproducing a significant portion of the code. For example, writing a program that uses several chunks of code from this book does not require permission. Selling or distributing a CD-ROM of examples from O’Reilly books does require permission. Answering a question by citing this book and quoting example code does not require permission. Incorporating a significant amount of example code from this book into your product’s documentation does require permission.
We appreciate, but do not require, attribution. An attribution usually includes the title, author, publisher, and ISBN. For example:
The Python Data Science Handbook by Jake VanderPlas (O’Reilly). Copyright 2016 Jake VanderPlas, 978-1-491-91205-8.
If you feel your use of code examples falls outside fair use or the per‐ mission given above, feel free to contact us at permissions@oreilly.com.
Installation Considerations
Installing Python and the suite of libraries that enable scientific computing is straightforward . This section will outline some of the considerations when setting up your computer.
Though there are various ways to install Python, the one I would suggest for use in data science is the Anaconda distribution, which works similarly whether you use Windows, Linux, or Mac OS X. The Anaconda distribution comes in two flavors:
Miniconda gives you the Python interpreter itself, along with a command-line tool called
condawhich operates as a cross-platform package manager geared toward Python packages, similar in spirit to the apt or yum tools that Linux users might be familiar with.Anaconda includes both Python and conda, and additionally bundles a suite of other pre-installed packages geared toward scientific computing. Because of the size of this bundle, expect the installation to consume several gigabytes of disk space.
Any of the packages included with Anaconda can also be installed manually on top of Miniconda; for this reason I suggest starting with Miniconda.
To get started, download and install the Miniconda package–make sure to choose a version with Python 3–and then install the core packages used in this book:
[~]$ conda install numpy pandas scikit-learn matplotlib seaborn jupyterThroughout the text, we will also make use of other more specialized tools in Python's scientific ecosystem; installation is usually as easy as typing conda install packagename.
For more information on conda, including information about creating and using conda environments (which I would highly recommend), refer to conda's online documentation.