Minesweeper in Matplotlib
Lately I've been playing around with interactivity in matplotlib. A couple weeks ago, I discussed briefly how to use event callbacks to implement simple 3D visualization and later used this as a base for creating a working 3D Rubik's cube entirely in matplotlib.
Today I have a different goal: re-create minesweeper, that ubiquitous single-player puzzle game that most of us will admit to having binged on at least once or twice in their lives. In minesweeper, the goal is to discover and avoid hidden mines within a gridded minefield, and the process takes some logic and quick thinking.

To implement this in matplotlib, at its most stripped-down level, simply requires us to register mouse clicks on the plot window, and to have the window respond in the appropriate way. The rest is just the logic underneath.
Event Callbacks
Matplotlib contains several built-in event callbacks. You can register
key presses (with 'key_press_event' and 'key_release_event'),
mouse clicks (with 'button_press_event' and 'button_release_event'),
mouse movement (with 'motion_notify_event'), and much more. For
a full listing of the events that can be bound to functionality, see the
documentation of the function 'matplotlib.pyplot.connect'.
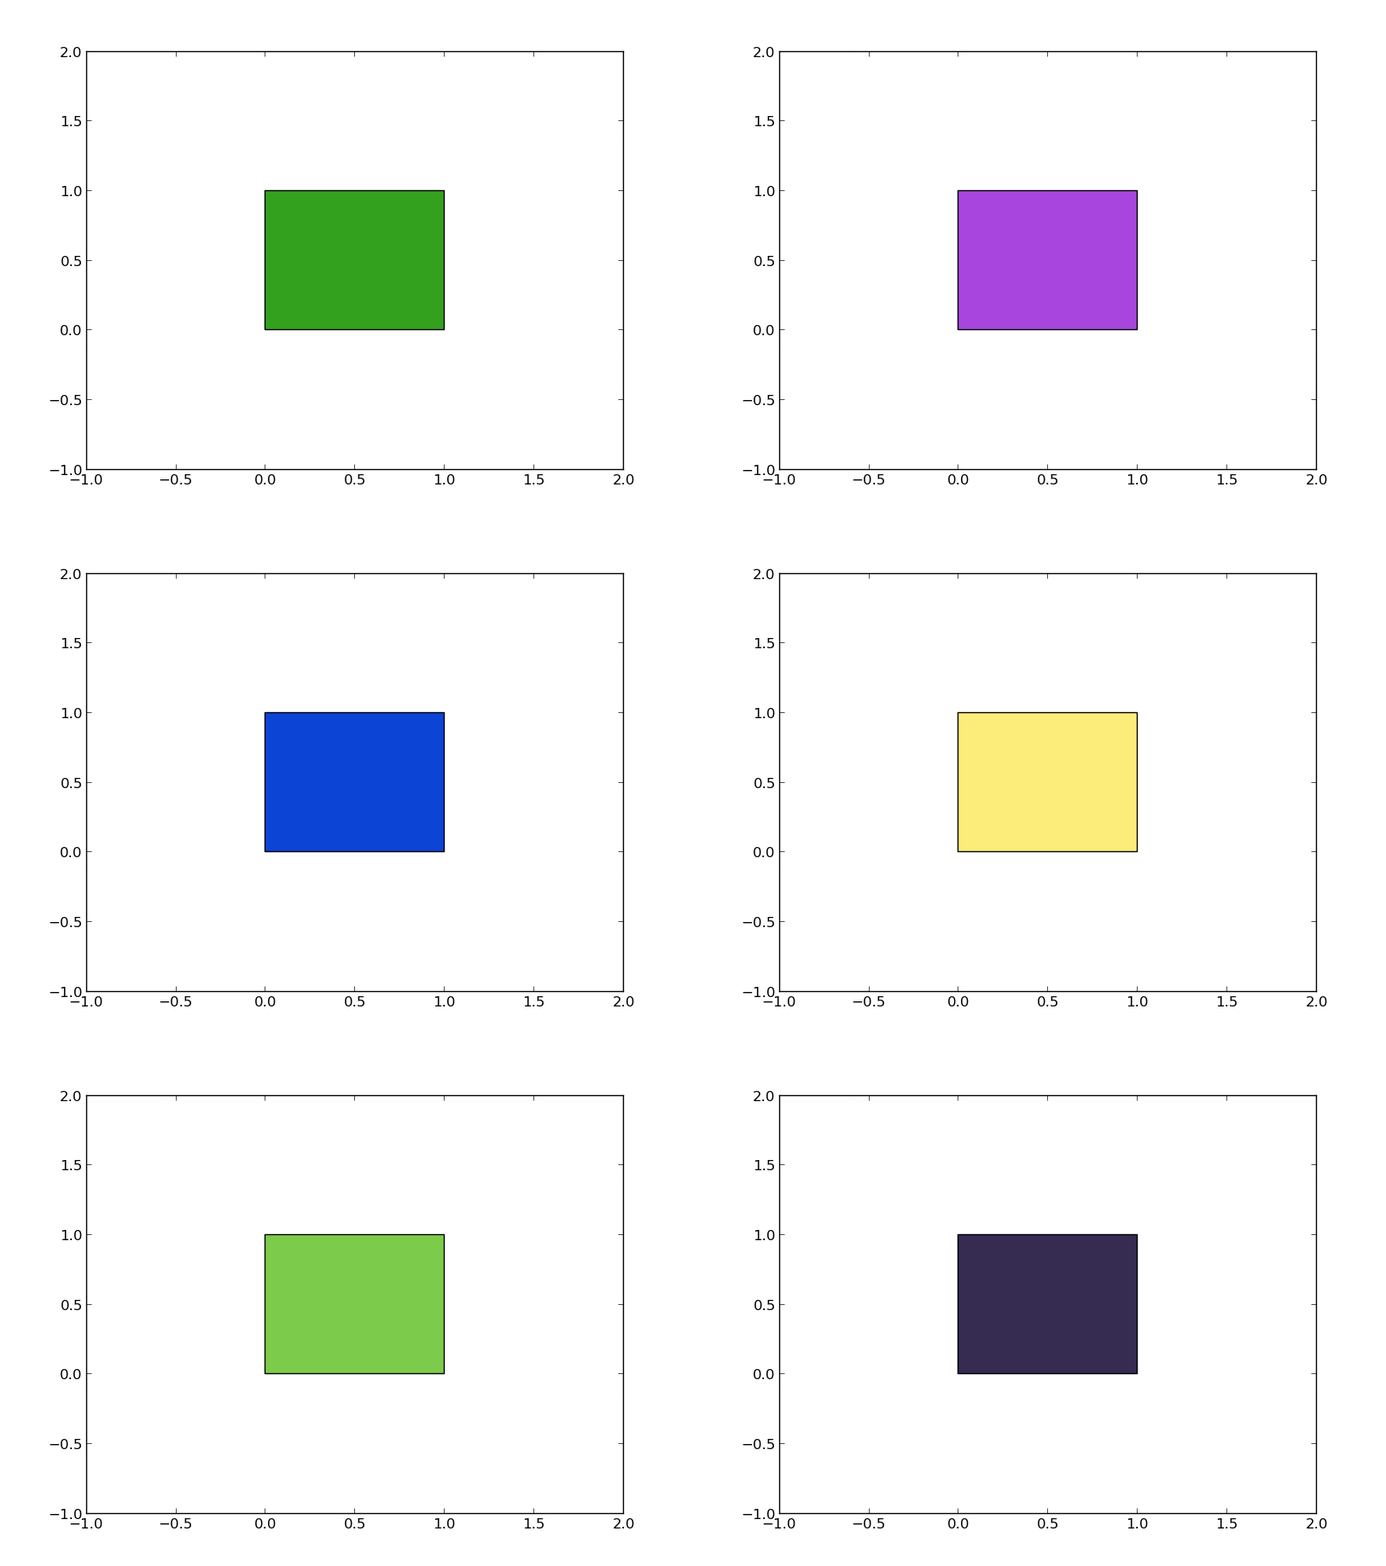
As a simple example, here we'll create a polygon and a function which is called
each time the axis is clicked. The function on_click checks if the click
occured within the polygon, and if so changes the polygon to a random
color:
import numpy as np
import matplotlib.pyplot as plt

fig = plt.figure()
ax = fig.add_subplot(111, xlim=(-1, 2), ylim=(-1, 2))
polygon = plt.Polygon([[0, 0], [1, 0], [1, 1], [0, 1], [0, 0]])
ax.add_patch(polygon)

# Function to be called when mouse is clicked
def on_click(event):
    if polygon.contains_point((event.x, event.y)):
        polygon.set_facecolor(np.random.random(3))
        fig.canvas.draw()

# Connect the click function to the button press event
fig.canvas.mpl_connect('button_press_event', on_click)
plt.show()
The result will look something like this:

Checking whether a click event is within a polygon or any other artist is
a very common pattern. For this reason, matplotlib provides a built-in
pick event. You can think of this as an event similar to a mouse click,
but specifically generated by a plot artist when it is clicked.
Furthermore, a pick event is associated back to that particular plot
element, which can be easily referenced within the callback.
Here is a code snippet which gives is equivalent to the code above,
but uses pick events rather than button press events:
import numpy as np
import matplotlib.pyplot as plt

fig = plt.figure()
ax = fig.add_subplot(111, xlim=(-1, 2), ylim=(-1, 2))
polygon = plt.Polygon([[0, 0], [1, 0], [1, 1], [0, 1], [0, 0]])
ax.add_patch(polygon)

# set the picker to True, so that pick events are registered
polygon.set_picker(True)

# create a function to be bound to pick events: here the event has an
# attribute `artist` which points to the object which was clicked
def on_pick(event):
    event.artist.set_facecolor(np.random.random(3))
    fig.canvas.draw()

# bind pick events to our on_pick function
fig.canvas.mpl_connect('pick_event', on_pick)
plt.show()
Here we have used just a single polygon, but there's nothing to stop us from using multiple interactive polygons in a single window. Add some logic beneath it all, and the results can be extremely flexible. We'll go through one in-depth example below.
Minesweeper
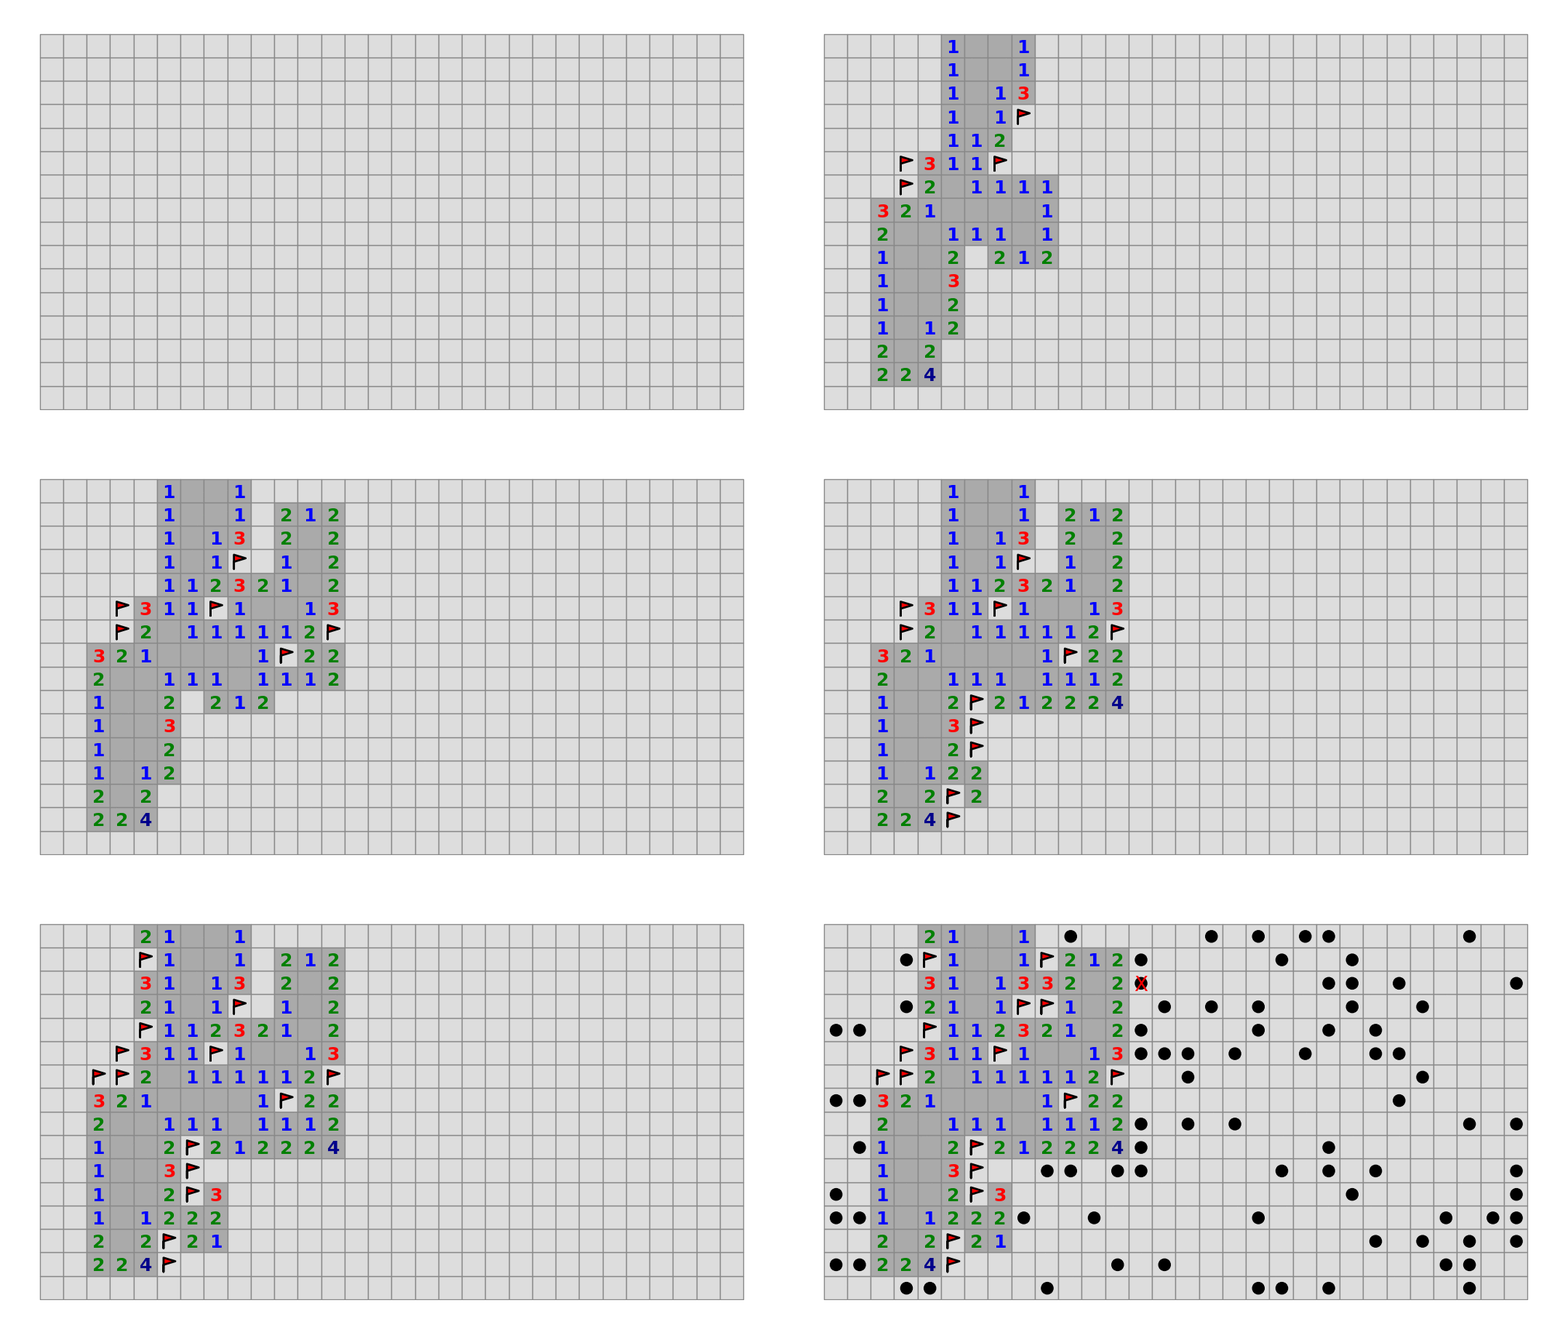
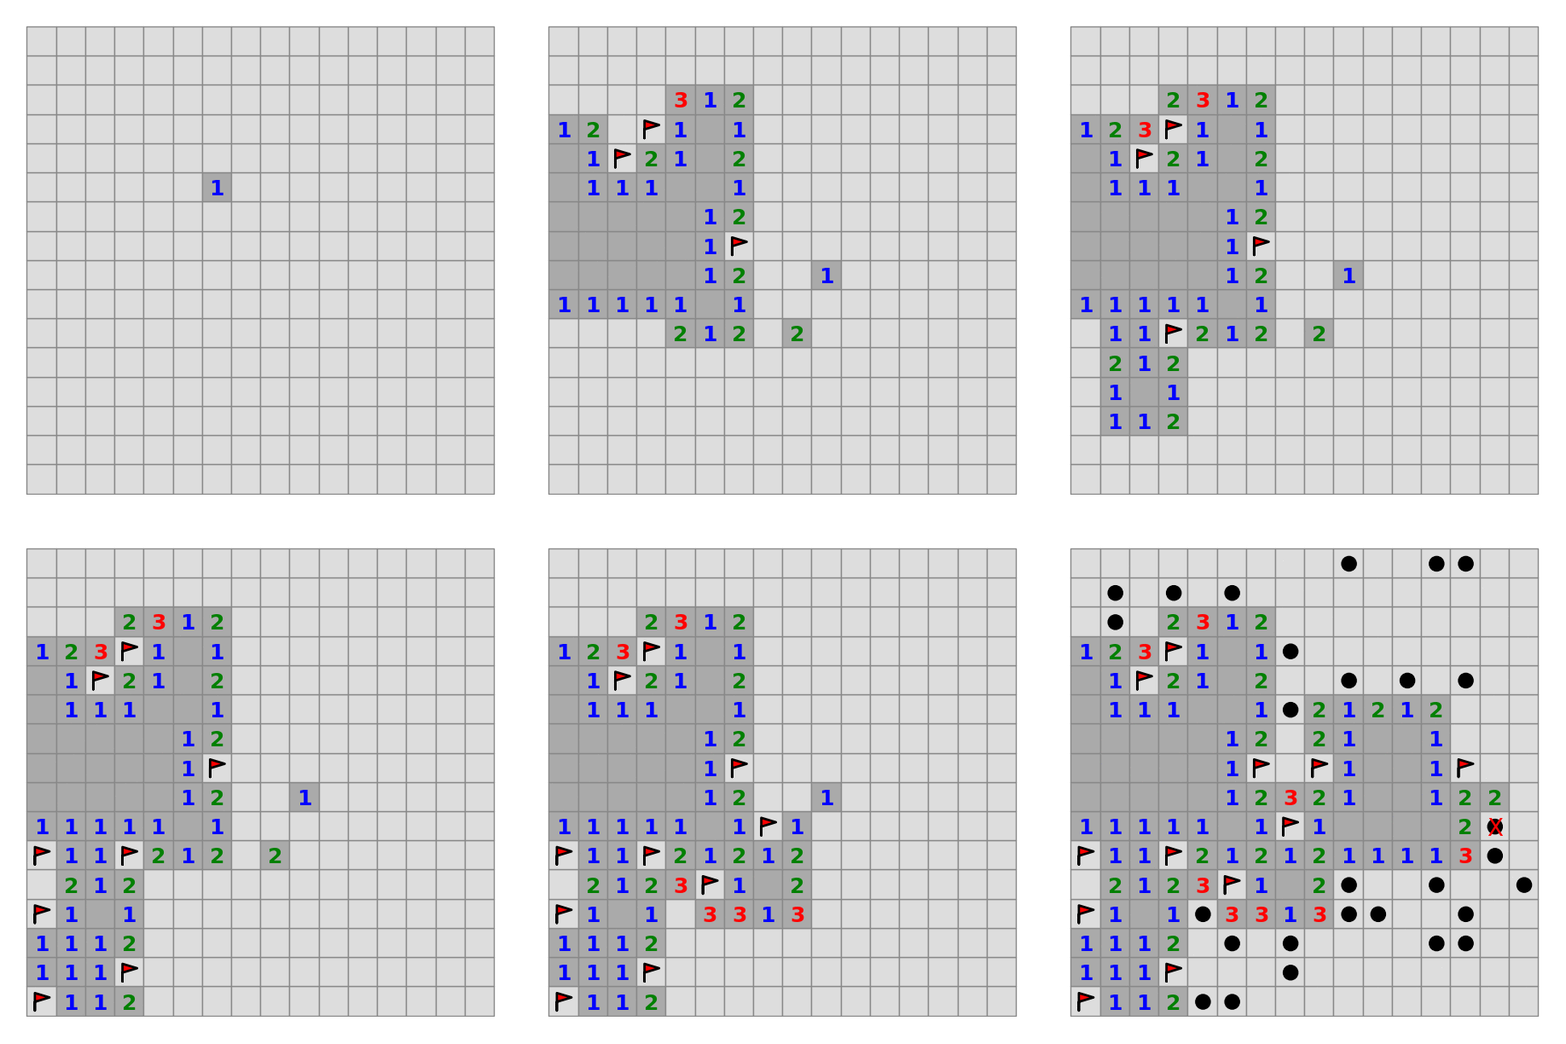
Using this simple machinery, let's create a basic implementation of the game Minesweeper. This involves creating a grid of polygons, with a certain number of them "containing" mines. Clicking the left mouse button will "uncover" the square, ending the game if a mine is underneath. If (as we'd hope) an uncovered square does not contain a mine, it will reveal a number reporting how many of the eight adjacent squares contain mines. The right mouse button is used to mark where we believe mines are.
There are some other more sophisticated features in the below code -- for example, clicking an already uncovered square with the correct number of adjacent mines marked will automatically clear the surrounding squares -- but rather than enumerating every programming decision, I'll just show you the code. It's less than 200 lines, but the results are pretty nice:

"""
Matplotlib Minesweeper
----------------------
A simple Minesweeper implementation in matplotlib.

Author: Jake Vanderplas <vanderplas@astro.washington.edu>, Dec. 2012
License: BSD
"""
import numpy as np
from itertools import product
from scipy.signal import convolve2d
import matplotlib.pyplot as plt
from matplotlib.patches import RegularPolygon


class MineSweeper(object):
    covered_color = '#DDDDDD'
    uncovered_color = '#AAAAAA'
    edge_color = '#888888'
    count_colors = ['none', 'blue', 'green', 'red', 'darkblue',
                    'darkred', 'darkgreen', 'black', 'black']
    flag_vertices = np.array([[0.25, 0.2], [0.25, 0.8],
                              [0.75, 0.65], [0.25, 0.5]])

    @classmethod
    def beginner(cls):
        return cls(8, 8, 10)

    @classmethod
    def intermediate(cls):
        return cls(16, 16, 40)

    @classmethod
    def expert(cls):
        return cls(30, 16, 99)

    def __init__(self, width, height, nmines):
        self.width, self.height, self.nmines = width, height, nmines

        # Create the figure and axes
        self.fig = plt.figure(figsize=((width + 2) / 3., (height + 2) / 3.))
        self.ax = self.fig.add_axes((0.05, 0.05, 0.9, 0.9),
                                    aspect='equal', frameon=False,
                                    xlim=(-0.05, width + 0.05),
                                    ylim=(-0.05, height + 0.05))
        for axis in (self.ax.xaxis, self.ax.yaxis):
            axis.set_major_formatter(plt.NullFormatter())
            axis.set_major_locator(plt.NullLocator())

        # Create the grid of squares
        self.squares = np.array([[RegularPolygon((i + 0.5, j + 0.5),
                                                 numVertices=4,
                                                 radius=0.5 * np.sqrt(2),
                                                 orientation=np.pi / 4,
                                                 ec=self.edge_color,
                                                 fc=self.covered_color)
                                  for j in range(height)]
                                 for i in range(width)])
        [self.ax.add_patch(sq) for sq in self.squares.flat]

        # define internal state variables
        self.mines = None
        self.counts = None
        self.clicked = np.zeros((self.width, self.height), dtype=bool)
        self.flags = np.zeros((self.width, self.height), dtype=object)
        self.game_over = False

        # Create event hook for mouse clicks
        self.fig.canvas.mpl_connect('button_press_event', self._button_press)

    def _draw_mine(self, i, j):
        self.ax.add_patch(plt.Circle((i + 0.5, j + 0.5), radius=0.25,
                                     ec='black', fc='black'))

    def _draw_red_X(self, i, j):
        self.ax.text(i + 0.5, j + 0.5, 'X', color='r', fontsize=20,
                     ha='center', va='center')

    def _toggle_mine_flag(self, i, j):
        if self.clicked[i, j]:
            pass
        elif self.flags[i, j]:
            self.ax.patches.remove(self.flags[i, j])
            self.flags[i, j] = None
        else:
            self.flags[i, j] = plt.Polygon(self.flag_vertices + [i, j],
                                            fc='red', ec='black', lw=2)
            self.ax.add_patch(self.flags[i, j])

    def _reveal_unmarked_mines(self):
        for (i, j) in zip(*np.where(self.mines & ~self.flags.astype(bool))):
            self._draw_mine(i, j)

    def _cross_out_wrong_flags(self):
        for (i, j) in zip(*np.where(~self.mines & self.flags.astype(bool))):
            self._draw_red_X(i, j)

    def _mark_remaining_mines(self):
        for (i, j) in zip(*np.where(self.mines & ~self.flags.astype(bool))):
            self._toggle_mine_flag(i, j)

    def _setup_mines(self, i, j):
        # randomly place mines on a grid, but not on space (i, j)
        idx = np.concatenate([np.arange(i * self.height + j),
                              np.arange(i * self.height + j + 1,
                                        self.width * self.height)])
        np.random.shuffle(idx)
        self.mines = np.zeros((self.width, self.height), dtype=bool)
        self.mines.flat[idx[:self.nmines]] = 1

        # count the number of mines bordering each square
        self.counts = convolve2d(self.mines.astype(complex), np.ones((3, 3)),
                                 mode='same').real.astype(int)

    def _click_square(self, i, j):
        # if this is the first click, then set up the mines
        if self.mines is None:
            self._setup_mines(i, j)

        # if there is a flag or square is already clicked, do nothing
        if self.flags[i, j] or self.clicked[i, j]:
            return
        self.clicked[i, j] = True

        # hit a mine: game over
        if self.mines[i, j]:
            self.game_over = True
            self._reveal_unmarked_mines()
            self._draw_red_X(i, j)
            self._cross_out_wrong_flags()

        # square with no surrounding mines: clear out all adjacent squares
        elif self.counts[i, j] == 0:
            self.squares[i, j].set_facecolor(self.uncovered_color)
            for ii in range(max(0, i - 1), min(self.width, i + 2)):
                for jj in range(max(0, j - 1), min(self.height, j + 2)):
                    self._click_square(ii, jj)

        # hit an empty square: reveal the number
        else:
            self.squares[i, j].set_facecolor(self.uncovered_color)
            self.ax.text(i + 0.5, j + 0.5, str(self.counts[i, j]),
                         color=self.count_colors[self.counts[i, j]],
                         ha='center', va='center', fontsize=18,
                         fontweight='bold')

        # if all remaining squares are mines, mark them and end game
        if self.mines.sum() == (~self.clicked).sum():
            self.game_over = True
            self._mark_remaining_mines()

    def _button_press(self, event):
        if self.game_over or (event.xdata is None) or (event.ydata is None):
            return
        i, j = map(int, (event.xdata, event.ydata))
        if (i < 0 or j < 0 or i >= self.width or j >= self.height):
            return

        # left mouse button: reveal square.  If the square is already clicked
        # and the correct # of mines are marked, then clear surroundig squares
        if event.button == 1:
            if (self.clicked[i, j]):
                flag_count = self.flags[max(0, i - 1):i + 2,
                                        max(0, j - 1):j + 2].astype(bool).sum()
                if self.counts[i, j] == flag_count:
                    for ii, jj in product(range(max(0, i - 1),
                                                min(self.width, i + 2)),
                                          range(max(0, j - 1),
                                                min(self.height, j + 2))):
                        self._click_square(ii, jj)
            else:
                self._click_square(i, j)

        # right mouse button: mark/unmark flag
        elif (event.button == 3) and (not self.clicked[i, j]):
            self._toggle_mine_flag(i, j)

        self.fig.canvas.draw()


if __name__ == '__main__':
    ms = MineSweeper.intermediate()
    plt.show()
There are still some things missing from this which are present in any good minesweeper implementation: a timer, the ability to reset the game without restarting the program, the ability to keep track of fastest times, and likely some more things I haven't thought of.
Regardless, this little script shows how incredibly powerful a framework matplotlib is. It can create an interactive Rubik's cube one day, publication-quality plots the next, and round out the season with a blast back to a classic Windows 3.1 time-sink. And for some reason, I find I have much more fun playing the minesweeper I built from scratch than the one that came with my system.
Enjoy!